Market Data & Tools
CoinGlass: Funding Rates, Open Interest and Liquidation Maps
Use CoinGlass to compare crypto funding rates, open interest and liquidation data across exchanges—without treating crowded-position estimates as trade signals.
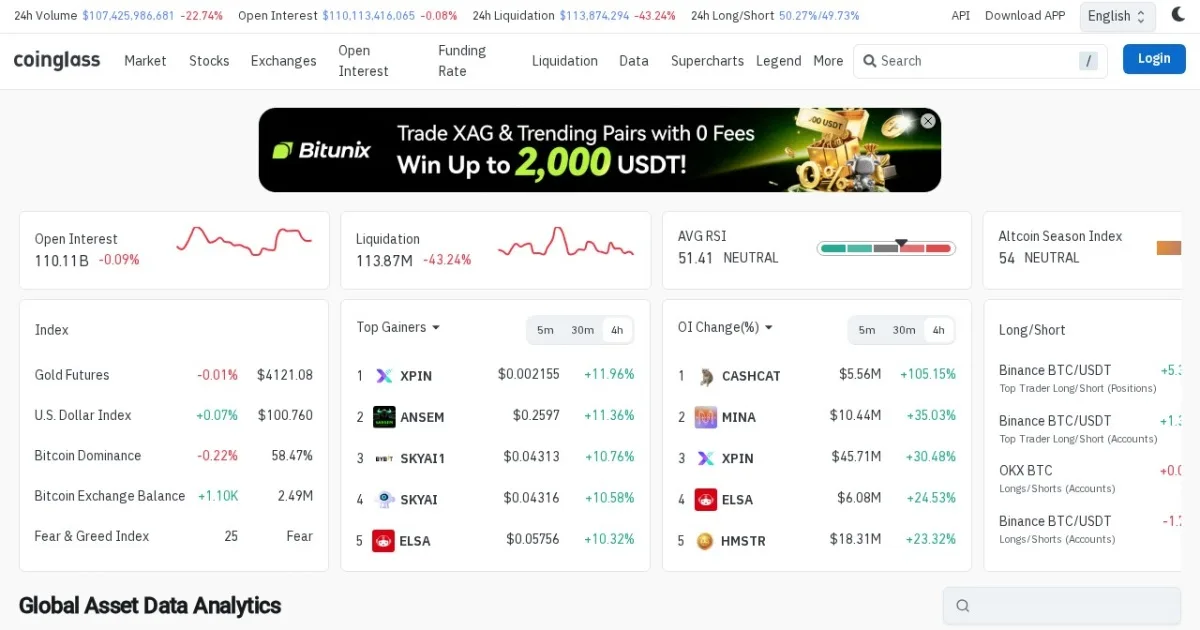
What it is. A derivatives-market data dashboard: real-time funding rates across exchanges, open interest, long/short ratios and liquidation statistics — the numbers that describe what leveraged traders are collectively doing.
When you need it. If you touch futures at all. Before opening a position, thirty seconds here answers: is funding extreme (crowded trade)? Did open interest just spike (fresh leverage in the market)? Where did recent liquidation cascades happen?
Getting started.
- Start with the funding rate page for your pair — compare across exchanges and note whether longs or shorts are paying.
- Watch open interest alongside price: rising OI on rising price means new money; rising price on falling OI means shorts covering.
- The liquidation heatmaps are estimates, but they illustrate vividly where over-leveraged positions cluster.
Safety reminder. Derivatives data is context, not signals — extreme funding can stay extreme for weeks. If terms like funding or open interest are new, read our futures basics and margin modes guide before trading with these dashboards open.